Table of Contents
1. Why False Signals Matter
False signals are one of the most frustrating—and costly—issues traders face in the forex market. They lead to unnecessary losses, shake confidence, and distort your trading strategy if not properly understood and managed.
Even experienced traders fall victim to false signals, especially when setups appear technically valid but fail without warning.
Case Example: EUR/USD Breakout Failure
In a detailed trading journal published on Medium, trader Andrew Rul shared how a seemingly strong EUR/USD breakout resulted in a full stop-loss hit within minutes. Here’s what he observed:
- RSI crossed 50
- MACD showed a bullish cross
- Price broke previous session highs
Despite these signals, the price reversed sharply after entry. On review, he found:
- There was no volume confirmation
- The move went against the 4H and daily trend
- The breakout occurred just before major economic news
Conclusion: the setup passed technical filters on the surface, but failed structurally.
Similar cases are reported regularly by traders on platforms like Reddit (r/Forex):
- Traders being “faked out” by range breakouts that reverse
- Price breaking above a trendline only to collapse
- Entries triggered by crossover systems with no follow-through

Why This Guide Matters
False signals can’t be eliminated completely—but they can be filtered with the right approach. This guide walks through a structured, practical methodology to help traders:
- Identify the core causes of false signals
- Use multi-factor confirmation to avoid traps
- Improve trade selection through structure, volume, and context
- Build a consistent filter to reduce poor entries
Imagine this:
You’ve been tracking EUR/USD for days. You’ve mapped the support levels, aligned your indicators, and watched the price compress into a textbook triangle. Finally, the breakout comes — a strong bullish candle, clear volume spike, RSI crossing above 50.
You enter long.
Within five minutes, the price snaps back violently and collapses 50 pips. Stop-loss hit. Trade over. Another “perfect” setup gone wrong.
“I followed everything I was taught. Trendline break, confluence… but it still reversed on me. What did I miss?”
— Andrew Rul, trader reflection on Medium
This scenario isn’t rare. In fact, “false signals are a daily hazard,” even for experienced traders.
Why Do False Signals Happen?
False signals aren’t just “bad trades.” They’re “misleading setups” that appear valid — by price structure, indicators, or even volume — but break down because:
- The market lacked confirmation from higher timeframes
- Volume wasn’t supportive (false momentum)
- Volatility spikes (like news or session open) masked true intent
- Liquidity gaps caused emotional or premature entries
These traps are easy to fall into — especially when your trading system relies only on indicators or a single timeframe.
The Promise of This Guide
Over the next sections, I’ll walk you through the entire process of spotting and filtering out fake signals like a pro — not by adding more indicators, but by:
- Understanding how and why false signals form
- Building multi-layer filters that confirm trades with clarity
- Using volume, timeframes, price action, and market context together
- Practicing a simple execution checklist that keeps you from overtrading or chasing traps
By the end of this guide, you won’t just trade the charts—you’ll read the intent behind them.
2. What Is a False Signal in Forex Trading?
False signals are a common cause of avoidable losses in forex trading. They occur when a setup appears valid based on technical indicators, price action, or chart structure, but fails to follow through—often reversing sharply after triggering an entry.
According to Investopedia, a false signal is:
“An indication of a future price movement that gives a misleading impression, often caused by data anomalies, indicator lag, or market noise.”
In trading terms, it means entering a position based on incomplete or deceptive signals, only to watch the trade reverse and hit your stop-loss.
Key Causes of False Signals in Forex
False signals don’t happen at random. They usually appear under specific market conditions or technical circumstances. Understanding these helps traders avoid common traps.
1. Volatility Spikes Without Structure
- Often triggered by economic news, session opens, or unexpected headlines.
- Price breaks out of a key level but lacks follow-through.
- Common in low-liquidity conditions or thin markets (e.g., just before London or New York open).
Example: A breakout candle shoots above resistance during an NFP release, then reverses within minutes.
2. Low Volume Breakouts
- Price appears to break support or resistance, but does so without significant volume.
- No participation from institutional traders.
- These breakouts tend to fail or retrace quickly.
Why it matters: Breakouts without volume are usually unsustainable.
3. Choppy or Range-Bound Markets
- During consolidation, price oscillates with no trend.
- Indicators like RSI, MACD, or moving average crossovers frequently trigger premature entries.
- Traders mistake normal range movement for a breakout or reversal.
Result: Multiple whipsaws and small losses that add up over time.
4. Lagging Technical Indicators
- Most indicators use historical price data.
- By the time a crossover or signal appears, the move may be exhausted.
- Reliance on lagging indicators (like moving averages or MACD) without confirmation leads to false entries.
Solution: Use indicators with real-time price action confirmation (e.g., volume, structure, multi-timeframe analysis).
How False Signals Differ From Valid Setups
Here’s a breakdown comparing a false breakout versus a confirmed breakout:
| Feature | False Breakout | Confirmed Breakout |
| Price breaks resistance | ✅ Yes | ✅ Yes |
| Volume confirmation | ❌ Absent or low | ✅ Present (high or increasing volume) |
| Retest or structure hold | ❌ No retest, instant reversal | ✅ Retest confirms new support/resistance |
| Higher timeframe alignment | ❌ Opposes larger trend | ✅ Confirms larger timeframe direction |
| Momentum or follow-through | ❌ None, price reverses quickly | ✅ Clean continuation after breakout |
This comparison helps traders recognize that not all breakouts are equal. Real signals develop with supporting structure. False signals often occur in isolation.
3. Signal-Filtering Methodology: The Pro Trader’s Toolkit
Spotting a false signal is only half the solution. The more important skill is learning how to filter them out before they cost you money. Professional traders don’t rely on a single indicator or chart. They combine multiple filters—trend, volume, candlestick structure, and broader market context—to increase the probability that a signal is valid.
Below is a six-part filtering system designed to improve your trade selection process.
A. Trend Confirmation
Rule: Align your short-term entries with higher timeframe direction.
Before entering on the 15-minute or 1-hour chart, check whether the trend on the 4H or daily chart supports your trade idea. Entering counter-trend trades greatly increases the chance of a false signal.
For example, a bullish breakout on the 15-minute chart is more reliable if the 4H is in an uptrend and price is above the 200 EMA on the daily.
Checklist:
- Is price trending or ranging on the higher timeframe?
- Are moving averages aligned across timeframes?
- Is the trade in the direction of the dominant trend?
Diagram: Trend Alignment Flow
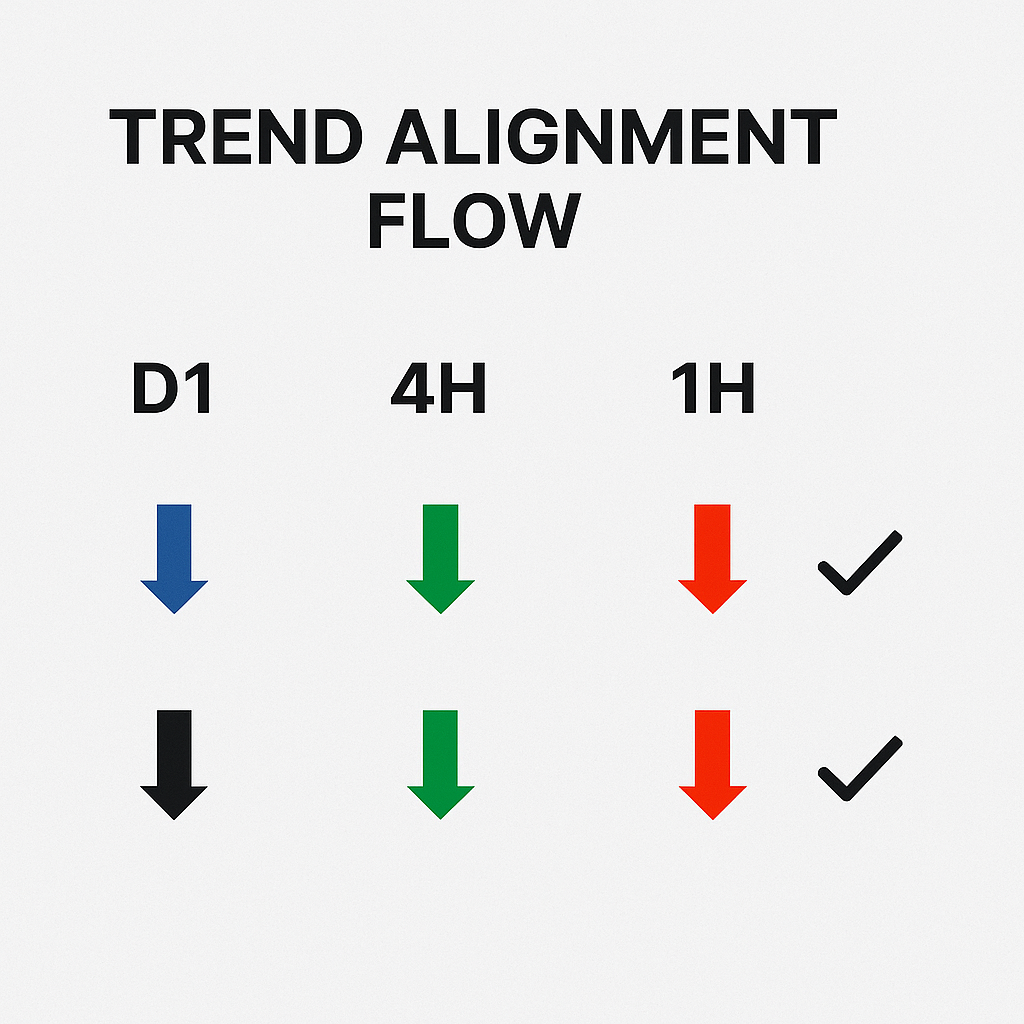
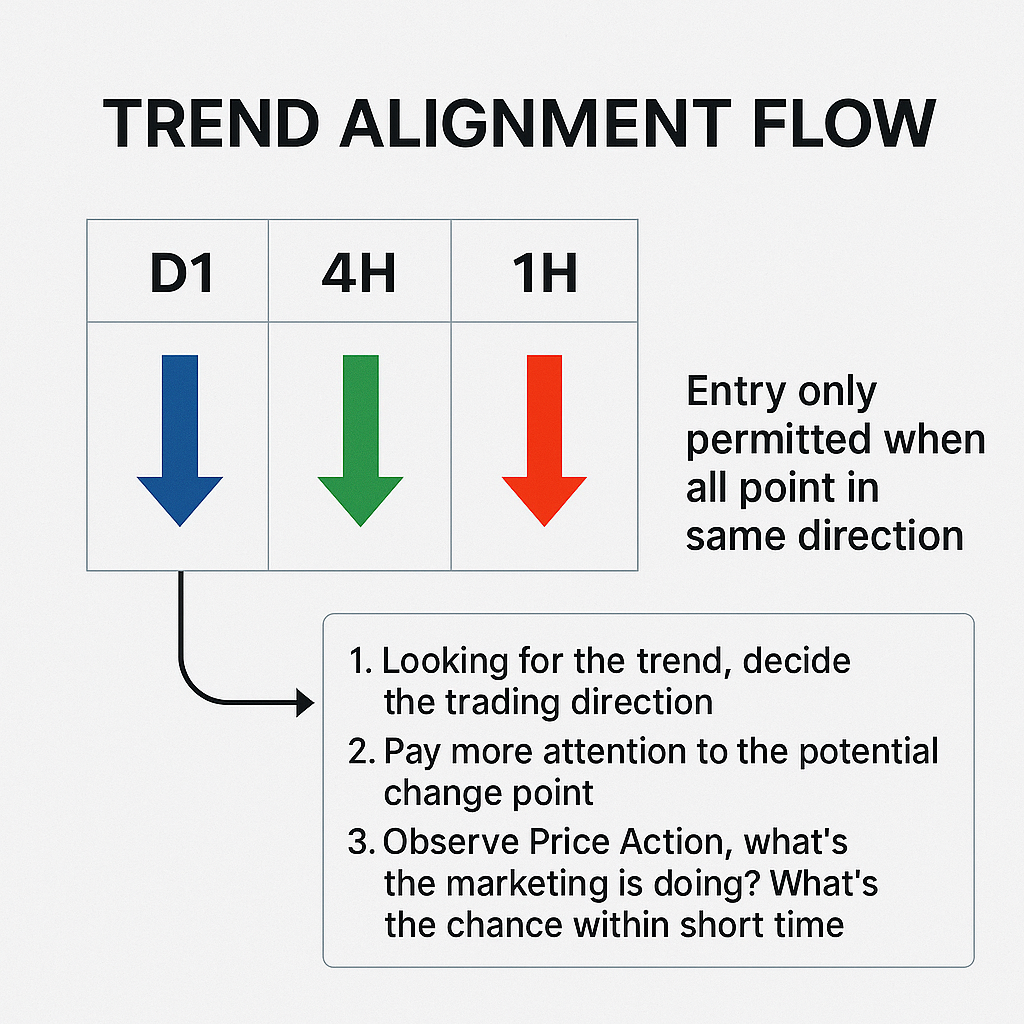
- Visual: 3 aligned timeframes (D1 → 4H → 1H). Entry only permitted when all point in same direction
3.2 Volume Confirmation
Rule: Only act on breakouts or reversals that occur on high or increasing volume.
Volume shows trader participation. When a breakout or reversal happens without volume, it’s often a trap—especially in low liquidity periods. Tools like On-Balance Volume (OBV) or Volume Oscillator can validate strength.
If price breaks resistance without a volume spike, assume it’s not sustainable.
Checklist:
- Is volume rising with price movement?
- Is volume supporting the breakout direction?
- Is volume diverging from price?
3.3 Candlestick & Price-Action Confirmation
Rule: Use candlestick formations to validate the quality of a signal.
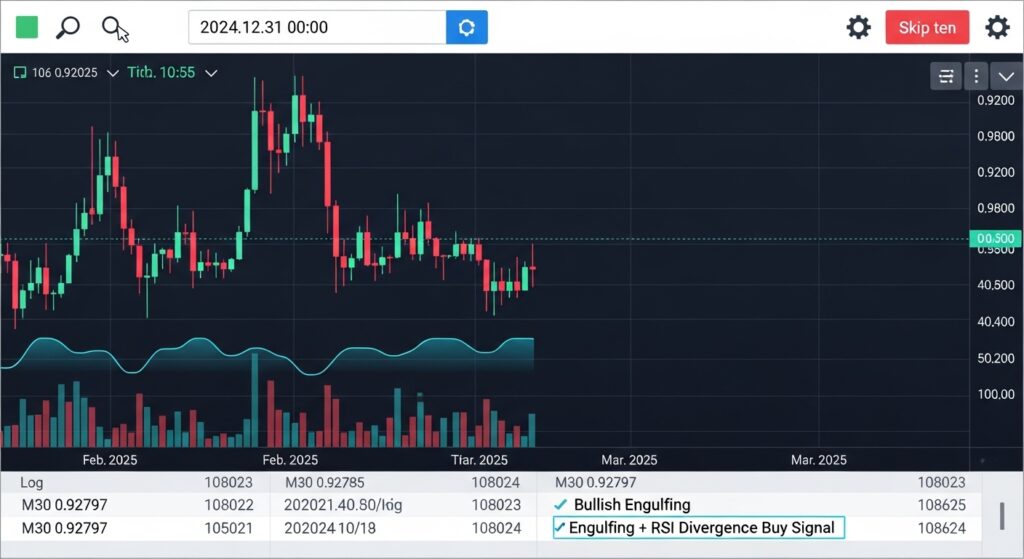
Price action remains one of the most reliable real-time confirmations. Rejection candles like pin bars, engulfing patterns, or doji near key levels are more meaningful than indicator signals alone. Combine this with divergence signals for added strength.
A bullish engulfing candle at support holds more weight than an RSI cross alone.
Checklist:
- Is there a strong rejection wick or engulfing candle?
- Is the candle forming at a key structure zone?
- Are momentum indicators (MACD, Stochastic) diverging from price?
Diagram: Candlestick Confirmation Matrix
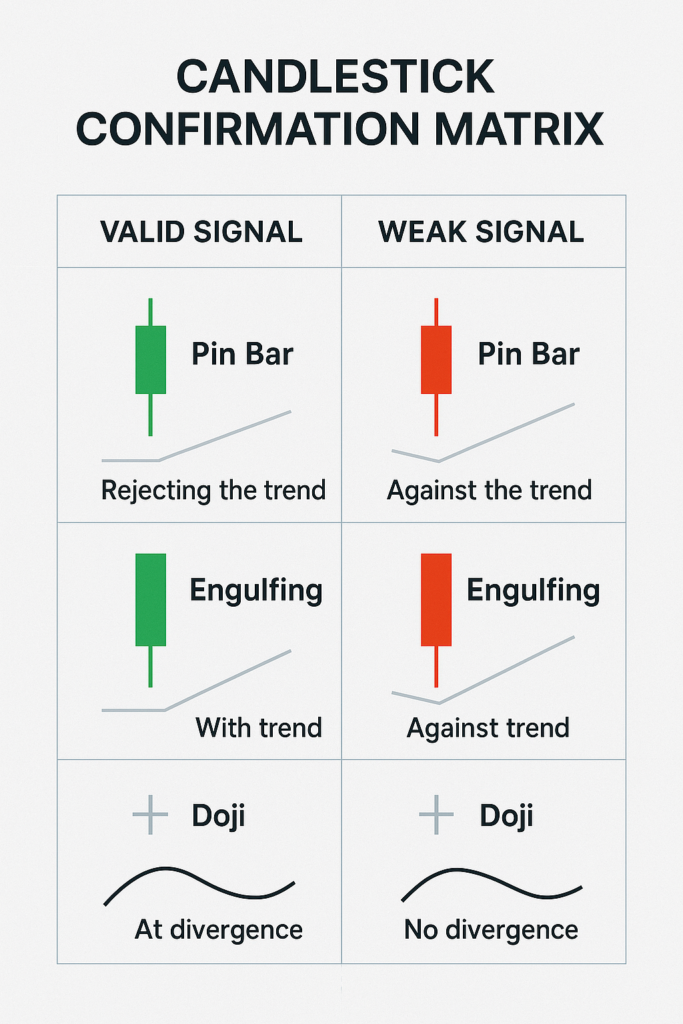
- 1: Visual matrix of valid vs weak signal patterns
- 2: Annotated examples: pin bar, engulfing, doji with trend/divergence overlay
3.4 Multi-Indicator Confluence
Rule: Don’t trust any single indicator. Require confirmation across categories.
Effective filters use multiple tools from different families:
- Trend: EMA, Supertrend
- Momentum: RSI, Stochastic
- Volatility: ATR, Bollinger Bands
Use these together to avoid isolated (and likely false) signals.
For example: A long trade is only valid if price is above 200 EMA, RSI is above 50, and ATR confirms active volatility.
Checklist:
- Trend confirmation (MA or Supertrend)
- Momentum confirmation (RSI > 50 or Stochastic cross)
- ATR not too low (to avoid dead ranges)
Indicator Confluence Rules
| Indicator Type | Signal | What to Look For |
| Trend | EMA/Supertrend | Upward slope, price above |
| Momentum | RSI/Stochastic | Cross above 50 or divergence |
| Volatility | ATR | Increasing or at average |
3.5 Timeframe Fractal Confirmation
Rule: Confirm your signal on alternative chart types or time compression.
Heikin-Ashi or Renko charts can eliminate minor noise and expose cleaner structure. These charts smooth out false spikes and are useful for validating breakout consistency.
If a Renko chart shows clean blocks in one direction, it’s more reliable than a noisy candle chart.
Checklist:
- Does Heikin-Ashi confirm direction and momentum?
- Do Renko blocks follow the same trend as your intended trade?
- Is the breakout or reversal consistent across both chart types?
3.6 Market Context Check
Rule: Avoid trading signals during high-risk or illiquid conditions.
False signals are most common:
- Around major news events (NFP, CPI, rate decisions)
- During session transitions or low-volume hours (e.g. post-NY/pre-Asia)
- On Fridays or Mondays with unstable sentiment
A breakout 10 minutes before a Fed rate release is not a high-probability trade.
Checklist:
- Is major news scheduled in the next 60 minutes?
- Is this during an overlap (London/NY) or dead zone (post-NY)?
- Is market volume strong, average, or thin?
4. Step-by-Step Signal Validation Workflow
This section walks you through a complete trade setup—from the first signal to trade execution—using the filtering system covered earlier. The goal is to demonstrate how professional traders eliminate false signals and only act on high-quality setups.
We’ll use a “bullish breakout scenario on EUR/USD” as an example.
Trade Scenario: EUR/USD Breakout Setup
You’re monitoring the EUR/USD on the 15-minute chart. Price is consolidating below a known resistance zone from the previous London session. You suspect a breakout is coming.
Instead of entering early, you apply the full validation process before committing capital.
Step 1: Identify Setup on the Entry Timeframe (15M)
- Price forms a flat range below resistance
- You see a strong bullish candle close above the zone
- RSI crosses above 50
- Stochastic shows a bullish cross
Observation: This is your initial signal, but not enough to enter yet.
Step 2: Confirm With Higher Timeframe (1H or 4H)
- Check the 1H chart: price is trending upward, showing higher highs and higher lows
- Check the 4H chart: price is still above the 200 EMA and approaching recent highs
Conclusion: The signal aligns with the broader trend. Trend Confirmation passed.
Step 3: Check Volume on Breakout Candle
- Use a volume indicator (standard or OBV)
- Confirm that the breakout candle has above-average volume
- If volume is flat or below normal → do not enter
Conclusion: You confirm a volume spike. Volume Confirmation passed.
Step 4: Wait for Pullback and Retest
- Rather than entering immediately, you wait for price to pull back and retest the broken resistance
- Price retests the breakout level and forms a bullish pin bar (rejection wick)
- This candlestick forms at the previous resistance → now acting as support
Conclusion: You now have candlestick + structure confirmation.
Step 5: Final Confirmation — Check Context and News
- No major economic news in the next hour
- It’s during London-New York overlap (peak liquidity)
- ATR shows healthy volatility range
Conclusion: Market Context is stable.
Step 6: Execute the Trade
- Entry: Buy at the bullish pin bar close
- Stop-loss: 10 pips below the pullback low
- Take-profit: Based on 2R or structure level (e.g. prior high)
Risk-Reward Ratio: Minimum 1:2 — acceptable trade quality
Lot size: Adjusted based on account size and stop distance
Execution Flowchart: Signal Validation to Execution
| Step | Description | Criteria |
| 1 | Spot initial setup | Breakout, indicator trigger on entry chart |
| 2 | Confirm trend direction | Higher timeframes support setup |
| 3 | Check volume strength | Volume spike present on breakout candle |
| 4 | Wait for retest | Pullback to breakout level + price reaction |
| 5 | Confirm candle structure | Pin bar or engulfing rejection |
| 6 | Validate market conditions | News-free window, decent liquidity |
| 7 | Define trade plan | Entry, SL, TP with proper risk management |
| 8 | Execute the trade | With discipline and logged in journal |
5. Real‑World Examples & Case Studies
To put the signal-filtering process into perspective, this section examines real trade breakdowns shared by active forex traders—including those who applied signal validation and those who ignored it. These examples highlight how following or skipping the filtering workflow can directly affect trade outcomes.
Example 1: GBP/USD Long Trade — Ignoring Trend Context
Trader: Andrew Rul
Platform: Medium (source)
Setup:
- GBP/USD broke above short-term resistance on the 15-minute chart
- RSI and MACD flashed bullish signals
- Trade entered long immediately on breakout
What Went Wrong:
- The 4-hour trend was strongly bearish
- Daily chart showed price under the 200 EMA
- There was no significant volume spike
- No retest of structure before entry
Result:
Trade reversed within the hour → Stop-loss hit.
Lesson:
Even when multiple indicators align, ignoring the higher timeframe trend dramatically increases the probability of a false signal.
Connection to Methodology:
- ❌ Trend confirmation was missing
- ❌ No volume check
- ❌ No retest confirmation
Example 2: EUR/USD False Breakout Avoided — Using Patience + Structure
Trader: Andrew Rul (same case study)
Setup:
- EUR/USD broke above previous day’s highs on 15-minute chart
- Bullish momentum appeared on RSI and MACD
- Price quickly returned inside the range after the breakout candle
Trader Action:
- Waited for confirmation on 1-hour chart
- Noted no retest of broken resistance
- Spotted divergence on MACD
- Observed that volume remained flat
Decision: Trade avoided.
Result: Price reversed 60+ pips down within the next 2 hours — would have been a losing trade.
Lesson: Applying confirmation rules across structure, volume, and indicators helped avoid a common trap.
Connection to Methodology:
- ✅ Trend was flat → no strong bias
- ✅ Volume confirmation failed → trade skipped
- ✅ Candlestick and divergence warned against entry
Community Insights: What Traders Are Saying
Signal quality is often misunderstood—especially by beginners who treat every indicator trigger as a call to enter. These quotes from the trading community offer practical wisdom:
“How many pips at what risk? Think about it.”
— r/Forex user, discussing signal risk-to-reward misjudgment
Context: A trader posted a signal setup that risked 30 pips for a 15-pip gain.
Takeaway: A clean signal is not enough. The reward must justify the risk. Always assess the R:R ratio before entering.
“Signals should be treated just like indicators… manage your own risk.”
— r/Forex comment in response to over-reliance on third-party signals
Takeaway: A signal is only a suggestion—not an obligation to enter. It must still pass your system’s filters and risk criteria.
6. Spot‑Fake Signal Using Infographic
Filtering out false signals requires discipline and a structured approach. To make this easier, here is a simplified visual checklist that summarizes all key validation steps used by professional traders before entering a trade.
This checklist is designed to be used before every trade—especially in breakout or reversal setups where false signals are most common.
Spot‑Fake Signal Validation Checklist
1. Trend
- ✅ Confirm alignment with the higher timeframe (4H, D1)
- ⚠️ Avoid counter-trend entries unless clearly justified (e.g. divergence + structure break)
Key Question: Is this trade in the direction of the prevailing trend?
2. Volume
- ✅ Check for a spike or increase in volume supporting the breakout or reversal
- ⚠️ Avoid breakouts with flat or decreasing volume
Key Question: Is volume confirming the move, or is it weak/noisy?
3. Candlestick Structure
- ✅ Look for clear reversal or breakout candles: pin bars, engulfing, inside bars with strong close
- ⚠️ Avoid trades with indecisive or weak candles
Key Question: Is the candlestick structure clean and directional?
4. Indicator Confluence
- ✅ Use multiple indicators from different categories: trend, momentum, volatility
- ⚠️ Never act on a single indicator trigger
Key Question: Are multiple tools confirming this entry, or is it isolated?
5. Market Context
- ✅ Check for upcoming news, session timing, and liquidity environment
- ⚠️ Avoid trading during low liquidity, session transitions, or major announcements
Key Question: Is this a good time to be in the market?
How to Use This Checklist
Before every trade:
- Pause and go through all five filters
- Require at least 4/5 conditions to be met before entering
- Document the checklist in your trading journal for review and consistency
Why It Works
This checklist filters out:
- Emotion-based trades
- News-driven false signals
- Breakouts with no momentum
- Signals that “look right” but aren’t supported by structure
Over time, consistently applying this filter will improve trade quality, reduce stop-outs, and strengthen discipline.
7. Why Pro Traders Still See Fake Signals
Even with a solid strategy and years of experience, professional traders are not immune to false signals. In fact, some of the sharpest reversals and failed breakouts occur despite perfect technical setups. The reason lies beyond charts—in the structure of the modern market itself.
The Role of High-Frequency Trading and Market Microstructure
Many false signals aren’t just bad luck or poor strategy—they’re side effects of how today’s electronic forex markets operate.
According to research published on arXiv.org, institutional market participants—including high-frequency trading (HFT) firms—create complex price movements using rapid-fire orders, spoofing, and order book manipulation. These activities often result in:
- Fake breakouts
- Whipsaws near key levels
- Instant reversals after stop hunts
“Retail traders often respond to price levels after they’ve been manipulated to create the illusion of momentum.”
— Research summary, “Anomaly Detection in High-Frequency FX Markets” (arXiv)
How Institutions Create Signal Noise
Here’s how these tactics generate false triggers:
1. Spoof Orders
Institutions place large fake orders near breakout levels to lure retail traders. When price approaches the level, the spoof order is canceled, and the price reverses.
Impact: Retail traders enter on what looks like a valid breakout, but there’s no real liquidity to support it.
2. Stop-Hunting Liquidity Sweeps
Large players deliberately push price into stop zones—just above resistance or below support—to trigger retail stop-losses. After the flush, price reverses sharply.
Impact: A valid signal is generated, but it’s only used to collect liquidity, not to sustain a trend.
3. Latency Arbitrage by HFTs
High-frequency algorithms exploit milliseconds of pricing inefficiency to trigger micro-moves that confuse slower systems and traders.
Impact: Indicators (like RSI, MACD) may respond to these micro-movements with lag, generating misleading signals.
Real Example: GBP/USD Spoofing Case
In 2023, several traders on Reddit’s r/Forex reported a repeated spoofing pattern around the 1.2700 level on GBP/USD. Each time price approached the level during the London session:
- A large buy wall appeared on order books
- Price spiked briefly above resistance
- Orders were canceled; price reversed within seconds
“Looked like a breakout every time, but it never held. Total bait.”
— Reddit trader, r/Forex
These were textbook false signals, but not due to poor analysis. They were triggered by deliberate manipulation at the microstructure level.
Why Even Pros Get Caught
- Institutional activity isn’t visible on basic charting tools
- Most indicators don’t account for order flow or liquidity traps
- Some setups are technically perfect, but mechanically engineered to fail
Even experienced traders sometimes fall into these traps, especially when relying purely on price action or standard indicators without broader market context.
How to Reduce This Risk
While no strategy can fully eliminate these edge-case traps, here’s how professionals adapt:
| Strategy | Purpose |
| Use of volume profile or order flow tools | Detect fake liquidity zones |
| Trading during high-volume sessions only | Avoid thin-market manipulations |
| Avoiding entries just before news releases | Reduce risk of algorithmic spikes |
| Looking for confirmation on multiple timeframes | Filter out short-lived micro-moves |
8. Building a Robust Trading Routine
Recognizing and filtering false signals is only part of the job. The real edge comes from applying your system consistently—through disciplined execution, testing, and review.
Professional traders don’t rely on instincts. They operate by routine, backed by clear rules and tracked results.
Here’s how to build a trading routine that supports the system you’ve just learned.
1. Backtest Your Signal Filter
Before using your filtering criteria live, test it across historical data to confirm its effectiveness.
- Use TradingView or MT4’s backtesting tools
- Go back 3–6 months on your favorite pairs
- Log each setup: Did it pass all 5–6 filters? What was the outcome?
What to look for:
- Win rate when all filters are met
- Common conditions where signals fail
- Risk-reward consistency over time
Tip: Focus more on consistency and process than just outcomes during backtesting.
2. Forward Test in Demo or Micro Account
Apply the same criteria in a “live market” with no or minimal capital risk.
- Use a demo account or a micro lot account (e.g. $0.01/pip)
- Only trade setups that pass your full checklist
- Record every trade, including skipped ones
Purpose: Build execution discipline and validate your setup in real-time market conditions without pressure.
Duration: 3–4 weeks minimum, across all market sessions.
3. Keep a Trade Journal (Including Skipped Trades)
A good journal isn’t just about entries and exits—it’s about decision-making.
Log:
- The signal: breakout, pullback, reversal
- Your checklist (trend, volume, candle, context, etc.)
- Why you entered, or why you skipped
- Entry/Exit price, SL/TP
- Outcome and what you learned
“Skipped trades with solid reasoning are just as valuable as winning trades.”
— MT.RebelsFunding.com
4. Enforce Risk Rules Without Exception
Even perfect setups fail. The only way to stay profitable long-term is through “strict risk control.”
- Use “position sizing” based on account equity and SL distance
- Cap “max risk per trade” (e.g. 1–2% of account)
- Set “predefined stop-loss and take-profit” targets before you click ‘Buy’
- Avoid revenge trades after losses
What this prevents:
- Overexposure to a single trade
- Emotional overreaction after losses
- Blowing accounts from rare false breakouts
Tip: Use lot size calculators or automation tools to enforce your risk limits.
Sample Routine (Daily)
| Time | Task |
| 6:30 AM | Review economic calendar (e.g. Forex Factory, MyFXBook) |
| 7:00 AM | Mark major S/R levels on 1H/4H charts |
| 8:00 AM | Watch for setups on 15M chart (London Open) |
| During Day | Apply validation checklist before each entry |
| Post-Session | Journal all trades and missed setups |
9. Conclusion: Trading with Signal Intelligence
False signals are part of every trader’s journey—but they don’t have to be part of your long-term results.
The difference between struggling and consistent traders isn’t that one avoids losses entirely—it’s that “the consistent trader knows when not to act.” They filter signals with context, structure, and rules.
Good Signals Aren’t Just About Indicators
Many traders waste time searching for the “perfect” indicator or system that never fails. But the truth is:
No signal works in isolation.
What matters is how that signal fits into the larger market picture.
- A bullish breakout during low volume? Skip it.
- An RSI divergence during a flat range? Ignore it.
- A textbook pattern before a major news event? Wait.
The best traders don’t chase signals—they validate them.
Mastering Filters Reduces Stress and Emotional Trades
Following a step-by-step filtering method:
- Gives you clarity in high-pressure moments
- Prevents overtrading
- Lowers the emotional load of second-guessing every setup
- Helps you trust your process—even after a losing trade
When you trade with structure, you move from reacting to anticipating. From guessing to managing.
Final Thought
The market will always produce signals. Most won’t be real.
It’s your job to decide which ones deserve your money—and which ones deserve your patience.
Build the habit of saying “not yet” just as confidently as you say “enter.”
💬 We’d Love to Hear From You
What has helped you most in spotting or avoiding false signals?
- Do you use structure, indicators, volume, or something else?
- Have you created your own checklist or filtering routine?
- What’s one signal that trapped you recently—and what did you learn?
Drop your experience in the comments below. Your insight may help someone else trade smarter.

4 thoughts on “Spot Fake Forex Signals Like a Pro”